

FULL LENGTH ARTICLE (Article PDF)
Vivianna A. Jensen* and Ashley L. Bennett⁺
School of Health Sciences, Barton College, Wilson, NC, USA
*Student author, ⁺Faculty mentor
CITATION
Jensen, Vivianna A.; & Bennett, Ashley L. (2026). Bioinformatics of the oral microbiome. Barton Journal, 1(1), 72–89. https://bartonjournal.org/vol-1-no-1/2026-cat1-article-no-003
Abstract
Bioinformatics analysis of the human oral microbiome is facilitating a better understanding of the human oral microbial inhabitants, variation of the oral microbiome across individuals, and links to oral and systemic human health, disease, and function. This research aims to identify patterns in taxonomic composition associated with rheumatoid arthritis and health by integrating bioinformatics with supervised and unsupervised machine learning tools to cluster publicly available human oral microbiome databases for both healthy and rheumatoid arthritis cohorts. Specifically, supervised machine learning was used to train a classifier model to predict the risk of developing rheumatoid arthritis from a given microbial genus cluster. The microbial genus clusters were input into the classifier model for rheumatoid arthritis risk predictions. While the classifier model was not robust for predicting rheumatoid arthritis risk, the classifier was able to make robust predictions about healthy cohorts and identify specific species strongly correlated with health, and identified some species of interest associated with rheumatoid arthritis. Although the classifier could not predict rheumatoid arthritis risk, the discovery of species strongly associated with healthy cohorts highlights the potential for probiotic-based preventive and therapeutic interventions. These findings highlight the importance of taxonomic analysis in facilitating disease risk predictions and advancing personalized dentistry and medicine, and reducing healthcare costs by implementing more targeted diagnostics and treatments.
Keywords: Bioinformatics, bacteria, taxonomy, periodontal disease, machine learning
Oral Microbial Diversity and Disease Development
The oral cavity houses about twenty billion bacterial individuals, representing a wide variety of species (Caselli et al., 2020). Alongside bacterial species, microbes such as fungi, viruses, and protozoa cling to the surfaces of the teeth and other oral cavity tissues to survive and reproduce (Baker, 2023). Emerging evidence suggests connections between the oral microbiome and more systemic health effects (Mei et al., 2020). Many oral bacterial microbes in plaque can cause damage to the mouth by eroding the enamel over time with their acidic properties. This metabolic activity is the number one cause of dental caries and tartar buildup (Baker, 2023). Anaerobic bacteria are common in the oral cavity and remain difficult to culture due to the need for a low- or no-oxygen environment. These anaerobic bacteria are the major etiologic agents contributing to chronic periodontitis by directly and indirectly destroying periodontal tissue, causing an intense inflammatory response (How et al., 2016).
The anaerobic bacteria in the oral cavity not only lead to deterioration of periodontal tissues but also increase the risk for adverse systemic health effects, mainly by promoting systemic inflammation and immune dysregulation (How et al., 2016). Furthermore, mounting evidence suggests relationships between the microbial populations and chronic conditions such as rheumatoid arthritis (RA) (Mei et al., 2020). With the link between inflammation and chronic disease well-established, these findings highlight that the oral microbiome is not isolated but interacts dynamically with the rest of the body, making it an important factor in overall health and a potential target for disease prevention and therapeutic intervention.
Age, diet, and dental hygiene are considered key factors in dental health as well. Tissue weakens and stretches over time, leading to gomphosis joint loosening, requiring partial or permanent tooth extractions (Salah et al., 2025). Attentive dental hygiene, like brushing and flossing, significantly slows oral deterioration by removing bacterial colonies that target the enamel, dentin, pulp cavity, and gum tissue (Salah et al., 2025). Flossing further helps by slowly hardening the gum tissue, increasing gum tolerance to penetration and abrasions. Simple dental hygiene procedures reduce the risk of gingivitis and periodontal disease by up to 50% (Salah et al., 2025). Other practices like smoking, vaping, chewing tobacco, and oral nicotine patches have impacts on oral health, frequently leading to significant damage to the mouth, including gum and bone loss (Baker, 2023).
Diet plays a crucial role in the likelihood of microbiome survival. Recent studies have shown that low levels of 2-5% of daily food consumed are used to feed microbiota in the human body (Zaske, 2025). Food’s varying levels of pH, temperature, and salinity can impact the body’s microbiota by either killing the microbiota or slowing down microbial functions in the body significantly. While the oral microbiome can have negative health impacts, the human microbiome generally provides many benefits, with some species of microbiota required for proper digestion and respiration.
In pursuit of a better understanding of the health impacts of microbes inhabiting the oral cavity, this journal article presents a bioinformatics analysis and machine learning classifier model to predict disease outcomes from the taxonomic genus of species living in the oral microbiome. The initial model serves as a preliminary proof of concept to demonstrate how bioinformatics tools, when integrated with machine learning, can predict health status based on microbial species present in the oral cavity, which could be determined by a simple saliva swab. Future work will expand and generalize this initial model to a wider variety of diseases with the hope of revealing a distinct and predictive microbial pattern between healthy and diseased cohorts.
Literature Review
Bioinformatics is a cocktail of biology, computer science, data science, and mathematics to analyze, store, and interpret large-scale complex biological data, including DNA, protein sequences, and microbiome datasets rapidly since the late 1960’s (Baker, 2023). Machine learning is a recent advancement of data science providing several powerful tools that can assist researchers in identifying trends in large-dimensionality data (Zhang et al., 2025).
Background
The oral microbiome is a diverse community of organisms living in the human mouth composed of a diverse abundance of bacterial species, along with fungi and viruses. Three crucial roles of the microbiome are maintaining oral health, preventing pathogen colonization, and supporting digestion (Caselli et al., 2020). When the oral microbiome is disturbed, it can result in mild or severe oral diseases (Salah et al., 2025). The presence of specific microbial species has been shown to promote systemic inflammation and immune dysregulation (How et al., 2016), for which there is a well-established link between systemic inflammation and chronic disease progression (Martel et al., 2022).
Traditional culture-based microbiology has been a great resource for studying microbes, but the inability to culture oral microbes like anaerobic species under standard lab conditions, the failure of culture conditions to replicate natural oral environments, and limited insight into microbial interactions have impeded the identification of causal relationships between oral microbiome populations and disease risk (Uzoukwu et al., 2022; Vartoukian et al., 2017). Bioinformatics and machine learning tools circumvent these shortcomings because the tools organize and identify patterns in high-dimensional datasets, allowing for adequate identification and characterization of uncultured microbes directly from patient samples.
Bioinformatics Approaches
Advances in 16S ribosomal RNA (rRNA) gene amplicon sequencing have enabled the comprehensive characterization of microbial communities within the oral cavity by targeting conserved regions of the bacterial genome to identify and classify microorganisms present in oral samples (Regueira-Iglesias et al., 2023). Shotgun metagenomic sequencing has been employed to provide species- and strain-level resolution and to characterize functional gene content within oral microbial communities (Baker, 2023). Subsequent downstream bioinformatics analyses focus on quantifying microbial diversity and community composition.
To ensure reproducibility and data transparency, modern oral microbiome studies employ standardized workflows, version-controlled code repositories, and public data deposition in repositories such as the NCBI Sequence Read Archive (SRA; Leinonen et al, 2011; Kodama et al, 2012; Katz et al, 2022). Collectively, these bioinformatics tools and techniques provide a robust framework for investigating the structure, diversity, and functional potential of oral microbial communities and for exploring and predicting their roles in oral and systemic health.
Application
Bioinformatics has a wide range of applications across science and healthcare. One example is disease detection. Bioinformatics helps identify microbial biomarkers associated with both oral and systemic disease, allowing for earlier diagnosis before clinical symptoms appear (Yeo et al., 2024). Information yielded from bioinformatics analysis can now inform the development of microbiome-based therapies, making treatments proactive rather than reactive (Salah et al., 2025).
Challenges
Despite the great attributes, bioinformatics has limitations. For instance, managing large datasets requires costly advanced computational resources – mainly vast hard drive space for storing data input and output and massive RAM memory for training models (Baker, 2023). Additionally, the sheer size and complexity of high-dimensional datasets tend to obfuscate identifications of trends. Furthermore, bioinformatic analysis can produce errors if the wrong models are applied, algorithms are misused, and distinguishing correlation from causation in microbiome studies remains an ongoing challenge, which can, in part, be overcome with modern machine learning algorithms (Regueira-Iglesias et al., 2023).
Machine Learning Tools
Machine learning provides powerful tools for analyzing large biomedical datasets and building classifier models to predict disease risk based on molecular, clinical, or microbiome features. In supervised learning, algorithms are trained on labeled datasets (e.g., healthy vs. diseased) to learn relationships between features and outcomes, whereas unsupervised learning methods identify patterns in unlabeled data (Traidl et al., 2025). These methods are applied in various ways to detect natural groupings, reveal disease subtypes, and select informative features for predictive modeling (Naeem et al., 2022).
Principal component analysis PCA is a common analysis to search for variance and identify patterns in large-dimensionality data (Traidl et al., 2025). The first and second components, PC1 and PC2, respectively, indicate the dimensions with the maximum variance and indicate features that may be predictive of different health status classes. Components with high variance are potential candidates as biomarker predictors of disease outcomes. The random forest approach is a particularly well-suited approach for training classifier models by aggregating the results of multiple decision trees into a single output (Traidl et al., 2025), which allows for more robust model predictions for both linear and non-linear data and can automatically select relevant features in the data, which in turn facilitates trend identification in heterogeneous data, such as microbiome and biomedical data (Traidl et al., 2025).
By enabling rigorous validation, reproducibility across independent datasets, and systematic evaluation of feature importance, machine learning addresses the challenge of distinguishing correlation from causation. When combined with thoughtful study design and experimental validation, these approaches support robust disease prediction and hypothesis generation in complex biological systems.
Findings
Bioinformatics and machine learning tools have revolutionized oral microbiome research, allowing scientists to identify thousands of previously unrecognized species, analyze functional capabilities of microbial communities, and emphasize associations with oral and systemic health. While much has been done to collect oral microbiome data and develop analytical tools, there remains much to be learned about the relationship between the oral microbiome and disease risk.
Methods
The Expanded Human Oral Microbiome Database (eHOMD) documents the human microbiome by providing the identity of >8,000 genomes across > 830 microbial taxa inhabiting the nasal passages, sinuses, throat, esophagus, mouth, and the lower respiratory tract (Baker, 2023; Fernández Escapa et al., 2018). The eHOMD also includes species-level taxonomy based on grouping 16S RNA gene sequences at 98.5% identity, a systematic naming scheme for unnamed and uncultivated microbial taxa, reference genomes to facilitate metagenomic studies, and convenient cross-links to other databases that can facilitate mapping of taxonomic data to known disease status (Baker, 2023; Regueira-Iglesias et al., 2023). The taxonomic data from the eHOMD were chosen for analysis, given the wide diversity of represented species and the standardized formatting to facilitate bioinformatics analysis. mBodyMap also provides the data on >6,000 species isolated from >22 body locations in people of varying health and disease diagnosis, which was used to train the machine learning model to recognize microbial taxonomic genus predictors of disease (Jin et al., 2022). Data was acquired on 24 March 2026.
Implementation
Custom Python analysis scripts implementing Pandas, NumPy, SciPy, Scikit-learn, Biopython, and Matplotlib packages are the primary software packages used to process the data (Buitinck et al., 2013; Harris et al., 2020; Hunter, 2007; pandas development team, 2020; Virtanen et al., 2020). Data input, output, organization, and management were handled by Pandas. Imported taxonomic datasets from the eHOMD database were turned into structured data tables using the Pandas library. The workflow helps to remove incomplete records and format taxonomic labels by sorting, filtering, and grouping microbial species data to make it easier for the machine learning model to analyze. NumPy was used primarily for its ability to perform numerical and mathematical operations on large datasets, allowing for effective handling of large arrays of microbial abundance values with efficient usage of computational memory. The software provides statistical calculation and data transformation tools and improves computational efficiency when processing large microbiome datasets (Reguieora-Iglesias, 2023). SciPy is exceptionally strong at analyzing relationships between microbial taxa by providing a variety of prebuilt regression models for data fitting, helping support advanced mathematical operations involved with the machine learning algorithms (Baker, 2023).
Scikit-learn and Matplotlib were the final libraries used. Scikit-learn provides functions specializing in building machine learning models and clustering algorithms to identify patterns in microbial communities (Yeo et al., 2024). Matplotlib provides functions for data visualization and helps emphasize trends extracted from taxonomic composition between samples of healthy and RA status.
Machine Learning Workflow
The end-to-end workflow for building the machine learning classifier is depicted in Figure 1 and carried out in a Jupyter Notebook to facilitate thorough documentation of code commands, results, and data visualizations. Taxonomic data were downloaded from eHOMD onto a 2022 MacBook Air M2 with 857.2 GB of available storage, macOS Sonoma 14.4.1 operating system, and the healthy and disease cohort data were downloaded from mBodyMap databases onto the same machine. The downloaded files were renamed to reflect the source of the primary data source and the applications of the data contained within the file.
Once all datasets were downloaded, disease labels were added to the healthy and disease cohorts from the mBodyMap database and combined into a single data file. Subsequently, the combined disease status data were cleaned by removing any entries that had improperly formatted or missing values. The cleaned data were transformed into a feature matrix using the measured abundance as the featurization value. The feature matrix was subsequently normalized to ensure all feature values had comparable scales.
A random forest classifier implemented using scikit-learn with 200 estimators and the 80/20 train/test split was used to train a classifier using the combined, cleaned, and normalized disease status dataset. The 80/20 split of the data works such that 80% of the training data is used for training and 20% is used for model testing, allowing for assessment of model quality based on prediction accuracy for each class (i.e., healthy and RA). The model quality was assessed using the standard internal model quality metrics output by scikit-learn – mainly precision representing class prediction accuracy, recall reflecting the percentage of properly identified classes, f1 score that shows the balance between precision and recall, and support, which demonstrates how many samples in the training data are in each prediction class.
Figure 1
Workflow of Machine Learning Model
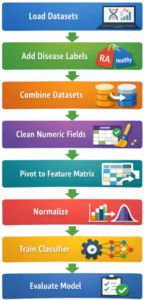
Note. A visual depiction of the workflow used to train the machine learning classifier model.
Classifier Model Predictions
After the classifier model was trained, taxonomic genus data from the eHOMD were fed into a k-means clustering algorithm using 5 clusters with the initial centroids chosen from the data at random. The resulting clusters were mapped back to the classifier feature space, normalized, and fed as input to the classifier model to predict the disease status associated with each taxonomic cluster. The species contained within each cluster was determined and compared to reveal potential microbial biomarkers of RA disease vs health and to determine places for improving the classifier model. Matplotlib was used for plotting and visualizing the results.
Results / Findings
The combined training dataset comprises microbial species associated with both healthy and RA class cohorts, with >400 microbial species, including 53 shared between the classes and 19 species specific to the RA class (Table 1). Species showing more than 5-fold change in abundance between healthy and RA classes are Pseudomonas fluorescens, Treponema succinifaciens, Schaalia meyeri, and Schwartzia succinivorans (Table 2), suggesting that the relative abundance of specific species may be an important predictor.
Table 1
The Total Number of Unique, Common, and Specific Species Observed in the healthy and rheumatoid arthritis (RA) cohorts
| Total unique species | 415 |
| Shared species | 52 |
| Healthy only species | 344 |
| RA only species | 19 |
Table 2
Class Comparison of the Mean Abundance of Shared Species
| Species | Healthy Mean | RA Mean | Fold Change |
| Pseudomonas fluorescens | 0.542 | 24.914 | 46.005 |
| Treponema succinifaciens | 0.082 | 0.833 | 10.184 |
| Schaalia meyeri | 0.330 | 2.631 | 7.967 |
| Schwartzia succinivorans | 0.082 | 0.583 | 7.130 |
| Streptobacillus hongkongensis | 0.122 | 0.405 | 3.319 |
| [Eubacterium] saphenum | 0.147 | 0.440 | 3.000 |
| Prevotella baroniae | 0.122 | 0.365 | 2.999 |
| Selenomonas sputigena | 0.717 | 1.907 | 2.661 |
| Selenomonas infelix | 1.260 | 2.563 | 2.033 |
Note. Species that were shared between both healthy and rheumatoid arthritis (RA) and demonstrated > 2-fold change in mean abundance between healthy and RA classes.
Classifier Model Performance
The initial classifier model performed strongly on identifying clusters associated with healthy status, accurately predicting 96% of healthy clusters, with 4% of the actually healthy class being mistakenly predicted as the RA class (Table 3). In contrast, the classifier model failed to accurately predict RA disease status, accurately predicting 0% of RA labelled entries (Table 3). Large differences in precision, recall, and F1 scores between the macro average and weighted averages indicate that one of the data classes is either over- or underrepresented (Table 3). The training data contained 54 data points associated with the healthy class and only 2 points with the RA class, demonstrating that the RA data is underrepresented in the training data, consistent with the discrepancy between macro and weighted averages (Table 3). This underrepresentation of the RA data in the training dataset is the most likely reason for the model’s failure to predict the RA class accurately.
Table 3
Statistics Reporting Classifier Model Prediction Quality
| precision | recall | f1-score | support | |
| healthy | 0.96 | 1.00 | 0.98 | 54 |
| RA | 0.00 | 0.00 | 0 | 2 |
| accuracy | 0.96 | 56 | ||
| macro avg | 0.48 | 0.50 | 0.49 | 56 |
| weighted avg | 0.93 | 0.96 | 0.95 | 56 |
Note. The precision, recall, f1-score, and support metrics determine the model accuracy in predicting healthy and rheumatoid arthritis (RA), given a microbial genus-based clustering.
Microbial Taxonomic Clustering
Cluster 0 was the largest cluster with 118 species (Figure 2). The smaller clusters 1, 2, 3, and 4 contained only a single genus each, with cluster 1 representing Actinomyces, cluster 2 representing Streptococcus, cluster 3 representing Neisseria, and cluster 4 containing Haemophilus genera. In contrast, the largest cluster 0 contained a wide diversity of microbial genera, some of which contained multiple species, while others appeared to contain only one species. The mapping of clusters 1-4 to specific genera indicates that a genus-based clustering of microbiome taxonomic genus is effective at separating out the microbial genera that are well represented in the microbiome. However, multiple different genera’s presence in cluster 0 suggests that genera with fewer than approximately 5 different species in the dataset are not able to be clustered in a meaningful way based on genus, with only 5 clusters.
Figure 2
Sizes of Microbial Genus Clusters
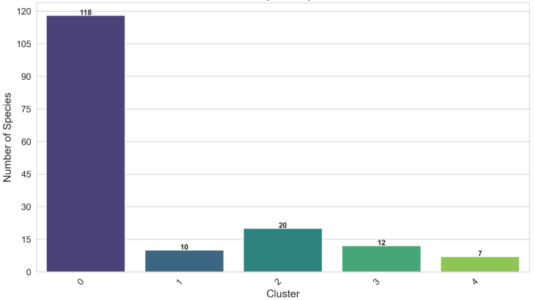
Note. The size of each microbial genus cluster (x-axis) as measured by the number of species in the cluster (y-axis).
PCA
The PCA of the genus-based clustering of microbes successfully separated the five different clusters, with the identified PC1 and PC2 accounting for about 21% and 20.4% of data variance, respectively (Figure 3A). The PCA of clustered microbial genus data demonstrates that all genus clusters are strongly dominated by the healthy class (Figure 3B). Clusters 0 and 3 have positive correlations with both principal components, cluster 0 positively correlating to PC1 and cluster 3 positively correlating to PC2 (Figure 3B). The remaining three clusters have either neutral or negative correlations with both principal components (Figure 3B). Cluster 3 shows a strong positive correlation with PC2 and contains only healthy class microbial genera, suggesting
that PC2 is associated with the healthy class. Clusters 1, 2, and 4 all contained only healthy classes and were well-separated along PC1 with a smaller separation along PC2 (Figure 3).
The only cluster with a positive correlation with PC1 is also the only cluster containing any RA class cohorts, which suggests that perhaps PC1 is an indicator of RA class (Figure 3B). However, this cluster is still strongly dominated by healthy class cohorts, which would alternatively suggest that PC1 is also an indicator of healthy class. The correlation between cluster 0 and PC1 is relatively weak and may indicate that the failure of the clustering algorithm to adequately separate out diverse genera is influencing the correlation value and obfuscating pattern detection. Further separation of the species contained in cluster 0 would likely be needed to draw definitive conclusions about the meaning of PC1.
Species examination, most strongly correlated with PC1 and PC2, reveals that Neisseria bacilliformis (N. bacilliformis) is the species most positively correlated with PC1, while Streptococcus vestibularis (S. vestibularis) was most negatively correlated with PC2. N. bacilliformis was also most positively correlated with PC1, and S. vestibularis was also most negatively associated with PC1. Additionally, N. bacilliformis and S. vestibularis both showed the largest discrepancy between PC1 and PC2 loadings, suggesting that these two species may be better predictors of health status than other species in the dataset. Interestingly, the PCA loadings revealed different species of interest than the fold change in abundances between the classes (Table 2), suggesting that PCA loadings may also be a useful feature to include in training.
Figure 3
Principal Component Analysis of Oral Microbiome Genus Clusters
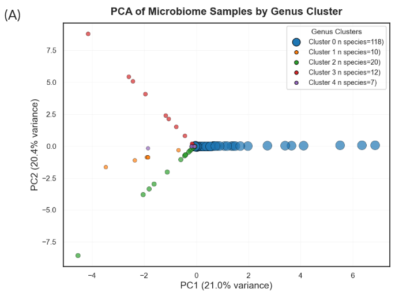
Notes. (A) Principal components 1 (PC1; x-axis) and principal component 2 (PC2; y-axis) explain approximately 21% and 20% of the data variance, respectively. Each point represents a species in the training data, consisting of microbial profiles from both healthy and rheumatoid arthritis cohorts, and is colored according to the cluster they belong to. Blue, orange, green, red, and purple represent cluster 0, cluster 1, cluster 2, cluster 3, and cluster 4, respectively. (B) The same PCA plots the centroids of each cluster, with the node size determined from the number of species contained within that cluster. Cluster nodes are colored according to their disease label: healthy (blue) and rheumatoid arthritis (RA; red), and labeled according to their cluster number.
eHOMD Taxonomic Cluster Model Predictions
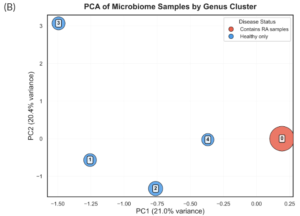
Despite the model’s failure to accurately predict RA, the eHOMD dataset was input to the classifier model in the hope that the prediction results would inform future efforts to improve and generalize the classifier model. Consistent with previous data observations, only one cluster was associated with a non-zero probability of RA class, with cluster 0 probability of 99% for the healthy class and 1% for the RA class (Figure 4A). Clusters 1-4 had a 100% probability of healthy class prediction (Figure 4B). All the clusters lie on the decision boundary, consistent with the RA class being underrepresented in the training data (Figure 4B). Continued improvements in model accuracy are needed before any further conclusions can be drawn from classifier model predictions.
Figure 4
Class Predictions for Microbial Genera Clusters
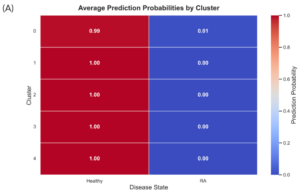
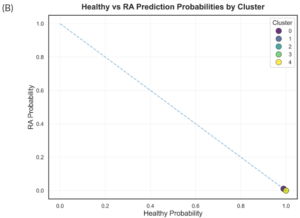
Notes. (A) A heatmap of the prediction probabilities for the two model classes (x-axis), healthy and rheumatoid arthritis (RA), in each of the five microbial genus clusters. The color gradient represents model-predicted disease probabilities for each cluster. Values range from 0 (blue), indicating low predicted probability of rheumatoid arthritis, to 1 (red), indicating high predicted probability. Intermediate colors reflect an increasing likelihood of disease classification. (B) A scatter plot representation of the probability of a RA vs. healthy class class predictions. The dashed diagonal line represents the decision boundary where predicted probabilities for Healthy and RA are equal.
Discussion
The presented work leverages publicly available oral microbiome databases to train a machine learning model capable of predicting health outcomes from clustered taxonomic data. Clustering of oral microbiome taxonomic data from the myBodyMap database and comparing the relative abundances of microbial species between healthy and RA cohorts revealed that Pseudomonas fluorescens, Treponema succinifaciens, Schaalia meyeri, and Schwartzia succinivorans all show more than 5-fold change between the two classes (Table 2). In the context of previous work, the observed clustering patterns suggest that well-represented genera form distinct, stable groupings, some of which are associated with healthy states, as opposed to unbalanced communities that can be potential disease precursors for periodontal and systemic health diseases (Figure 3). These findings are consistent with prior work, which has demonstrated that shifts in microbial composition, particularly increases in specific pathogenic taxa, are associated with disease progression.
The classifier model trained using a random forest algorithm with an 80/20 split in the training data showed robust predictions for the healthy class, but was unable to accurately predict the RA class, limiting the applicability of this model in its current training state. The failure of the classifier model to predict RA class is consistent with an imbalanced dataset used for machine learning training, particularly the underrepresentation of disease states such as RA. This imbalance likely contributed to the model’s inability to accurately predict disease outcomes, as it biased predictions towards the dominant healthy class. Additionally, the clustering approach may oversimplify the complexity of microbial ecosystems, particularly for less abundant taxa that could still play important biological roles. Exploring alternative clustering methods with different numbers of clusters would likely result in model improvements, especially for separating out cluster 0 species. Future work to improve this classifier model should incorporate larger datasets for training, especially including a larger diversity of body locations and disease classes to address the small training data size and the underrepresented RA class. Additionally, while the training data remains small, a 90/10 train/test split should be incorporated during model training so that a larger percentage of data can be used for training and a smaller percentage can be used for model testing and validation.
PCA identified PC1 and PC2 components that explain about 21% and 20.4% of the data, respectively. Cluster 3 only contained microbial species associated with the healthy class and was strongly positively correlated with PC2, indicating that PC2 represents the healthy class. While cluster 0 was most positively correlated with PC1 and was the only cluster to contain RA class cohorts, cluster 0 was still dominated by healthy cohorts, and the meaning of PC1 remains unclear.
Clusters 1-4 were dominated by particular genera, including Actinomyces, Streptococcus, Neisseria, and Haemophilus, and contained only healthy class cohorts (Figure 3). However, unlike some previous studies that identify clear separations between healthy and disease microbiomes, the present analysis did not find any genus clusters strongly predictive of disease. Cluster 0 contained some cohorts of the RA class, but was still dominated by the healthy class. Taken together, this clustering analysis suggests that taxonomic data alone may not always be sufficient to fully distinguish disease states without additional functional or environmental context.
Future work should focus on expanding the dataset size and diversity, particularly by increasing the representation of disease-associated samples. Incorporating additional data types such as metagenomic, transcriptomic, or metabolomic data and inclusion of more features in the training data may improve model performance and provide deeper insights. Furthermore, the application of more advanced machine learning techniques and strategies to address class imbalance, such as resampling or class weighting, could enhance predictive accuracy. This work contributes to a growing foundation for using microbiome data in predictive modeling and highlights the potential for integrating bioinformatics into clinical and public health applications.
Conclusion
While the classifier model was not successful in predicting RA class, the clustering analysis was able to detect shifts in the microbial populations between the health and RA class cohorts. Identified species of interest include Pseudomonas fluorescens, Treponema succinifaciens, Schaalia meyeri, Schwartzia succinivorans, Neisseria bacilliformis, and Streptococcus vestibularis. Despite the identification of potentially interesting species to investigate further, much work is needed to improve the clustering and predictive accuracy of disease classes. Improvements to the clustering and classifier can be made through several updates to the modeling workflow, including but not limited to different clustering techniques and the number of clusters, more advanced clustering and training algorithms, and, most importantly, by increasing the training dataset size, body location diversity, and disease classes represented within the training data.
Dentists are now well-positioned to use the results of oral microbioinformatics to prevent and initiate earlier treatment for oral health diseases. Instead of fighting against already present symptoms, dental specialists can use the results of a patient’s oral microbiome to reverse, prevent, or slow down periodontitis and gingivitis diseases, allowing older patients a fighting chance at restorative measures instead of major extractions. The prosthodontic, periodontal, and oral surgery possibilities for successful cosmetic and restorative work, including implants, implanted dentures, crowns, bridges, and bone and tissue grafts, will significantly increase the likelihood of positive oral health outcomes due to decreased probability of bone and tissue loss with personalized treatment planning and care.
With the realm of bioinformatics expanding, the application of oral microbiomics does not have to stop at dental medicine. It is likely that these techniques will eventually be incorporated into personalised healthcare and help healthcare practitioners to inform early diagnostics and treatment decisions. As a deeper understanding of the connections between the oral microbiome and systemic disease emerges, dentists will become integral members of the healthcare team and facilitate preventative and personalized oral health care. Dentists can promote early diagnosis by collecting oral swabs from patients and having them sent for taxonomic breakdown in labs, and then studying the results to determine if early disease preventative treatments are necessary for patients’ oral health.
Dentists can flag patients whose oral microbiome predicts more systemic health issues and work with primary caregivers to mitigate potential disease development in the future. Additionally, nurses, surgeons, and pharmacists can use bacterial taxonomic information from relevant microbiome studies to better assess individual patients, as opposed to treating every patient as if they were identical clones. Through this type of predictive screening and personalized medicine, dentists can collaborate with healthcare providers across many disciplines to improve diagnostics, treatments, and prognosis for patients, all while reducing healthcare costs.
References
Baker, Jonathon L. (2023). Illuminating the oral microbiome and its host interactions: Recent advancements in omics and bioinformatics technologies in the context of oral microbiome research. FEMS Microbiology Reviews, 47(5), fuad051. https://doi.org/10.1093/femsre/fuad051
Buitinck, Lars; Louppe, Gilles; Blondel, Mathieu; Pedregosa, Fabian; Mueller, Andreas; Grisel, Olivier; Niculae, Vlad; Prettenhofer, Peter; Gramfort, Alexandre; Grobler, Jaques; Layton, Robert; VanderPlas, Jake; Joly, Arnaud; Holt, Brian; & Varoquaux, Gaël. (2013). API design for machine learning software: Experiences from the scikit-learn project. arXiv preprint arXiv:1309.0238. https://doi.org/10.48550/arXiv.1309.0238
Caselli, Elisabetta; Fabbri, Chiara; D’Accolti, Maria; Soffritti, Irene; Bassi, Cristian; Mazzacane, Sante; & Franchi, Maurizio. (2020). Defining the oral microbiome by whole-genome sequencing and resistome analysis: The complexity of the healthy picture. BMC Microbiology, 20, 120. https://doi.org/10.1186/s12866-020-01801-y
Feng, Mei; Xie, Mengru; Huang, Xiaofei; Long, Yanlin; Lu, Xiaofeng; Wang, Xiaoli; & Chen, Lili. (2020). Porphyromonas gingivalis and its systemic impact: Current status. Pathogens, 9(11). https://doi.org/10.3390/pathogens9110944
Fernández Escapa, Isabel; Chen, Tsute; Huang, Yanmei; Gajare, Prasad; Dewhirst, Floyd E.; & Lemon, Katherine P. (2018). New insights into human nostril microbiome from the expanded Human Oral Microbiome Database (eHOMD): A resource for species-level identification of microbiome data from the aerodigestive tract. mSystems, 3(6), e00187-18. https://doi.org/10.1128/mSystems.00187-18
Harris, Charles R.; Millman, K. Jarrod; van der Walt, Stéfan J.; Gommers, Ralf; Virtanen, Pauli; Cournapeau, David; Wieser, Eric; Taylor, Julian; Berg, Sebastian; Smith, Nathaniel J.; Kern, Robert; Picus, Matti; Hoyer, Stephan; van Kerkwijk, Marten H.; Brett, Matthew; Haldane, Allan; Del Río, Jaime Fernández; Wiebe, Mark; Peterson, Pearu; Gérard-Marchant, Pierre; Sheppard, Kevin; Reddy, Tyler; Weckesser, Warren; Abbasi, Hameer; Gohlke, Christoph; & Oliphant, Travis E. (2020). Array programming with NumPy. Nature, 585, 357–362. https://doi.org/10.1038/s41586-020-2649-2
How, Kah Yan; Song, Keang Peng; & Chan, Kok Gan. (2016). Porphyromonas gingivalis: An overview of the periodontopathic pathogen below the gum line. Frontiers in Microbiology, 7, 53. https://doi.org/10.3389/fmicb.2016.00053
Human Oral Microbiome Database (HOMD). (2008). Human Oral Microbiome Database. https://www.homd.org/
Hunter, John D. (2007). Matplotlib: A 2D Graphics Environment. Computing in Science & Engineering, 9(3), 90–95. https://doi.org/10.1109/MCSE.2007.55.
Jin, Hanbo; Hu, Guoru; Sun, Chuqing; Duan, Yiqian; Zhang, Zhenmo; Liu, Zhi; Zhao, Xing-Ming; & Chen, Wei-Hua. (2022). mBodyMap: A curated database for microbes across the human body and their associations with health and diseases. Nucleic Acids Research, 50(D1), D808–D816. https://doi.org/10.1093/nar/gkab973
Katz, Kenneth; Shutov, Oleg; Lapoint, Richard; Kimelman, Michael; Brister, J. Rodney; & O’Sullivan, Christopher. (2022). The Sequence Read Archive: A decade more of explosive growth. Nucleic Acids Research, 50(D1), D387–D390. https://doi.org/10.1093/nar/gkab1053
Kodama, Yuichi; Shumway, Martin; Leinonen, Rasko; & International Nucleotide Sequence Database Collaboration. (2012). The Sequence Read Archive: Explosive growth of sequencing data. Nucleic Acids Research, 40(Database issue), D54-56. https://doi.org/10.1093/nar/gkr854
Leinonen, Rasko; Sugawara, Hideaki; Shumway, Martin; & International Nucleotide Sequence Database Collaboration. (2011). The sequence read archive. Nucleic Acids Research, 39(Database issue), D19-21. https://doi.org/10.1093/nar/gkq1019
Martel, Jan; Chang, Shih-Hsin; Ko, Yun-Fei; Hwang, Tsong-Long; Young, John D.; & Ojcius, David M. (2022). Gut barrier disruption and chronic disease. Trends in Endocrinology and Metabolism: TEM, 33(4), 247–265. https://doi.org/10.1016/j.tem.2022.01.002
Naeem, Samreen; Ali, Aqib; Anam, Sania; & Ahmed, Muhammad Munawar. (2023). An unsupervised machine learning algorithm: Comprehensive review. International Journal of Computing and Digital Systems.
Regueira-Iglesias, Alba; Balsa-Castro, Cristina; Blanco-Pintos, Tamara; & Tomás, Inmaculada. (2023). Critical review of 16S rRNA gene sequencing workflow in microbiome studies: From primer selection to advanced data analysis. Molecular Oral Microbiology, 38(5), 347–399. https://doi.org/10.1111/omi.12434
Roy, Somak; Coldren, Christopher; Karunamurthy, Arivarasan; Kip, Nefize S.; Klee, Eric W.; Lincoln, Stephen E.; Leon, Annette; Pullambhatla, Mrudula; Temple-Smolkin, Robyn L.; Voelkerding, Karl V.; Wang, Chen; & Carter, Alexis B. (2018). Standards and guidelines for validating next-generation sequencing bioinformatics pipelines: A joint recommendation of the Association for Molecular Pathology and the College of American Pathologists. The Journal of Molecular Diagnostics, 20(1). https://doi.org/10.1016/j.jmoldx.2017.11.003
Salah, Akram N.; Doghish, Youssef A.; Abbass, Shaimaa O.; Mansour, Reda M.; Sayed, Ghadir A.; Elshami, Nourhan H.; Abdel Mageed, Sherif S.; Mohammed, Osama A.; Abulsoud, Ahmed I.; Zaki, Mohamed Bakr.; Mosalam, Esraa M.; Elrebehy, Mahmoud A.; Alfarsi, Kareem; & Doghish, Ahmed S. (2025). Microbiota-based therapies in oral health and disorders. Folia Microbiologica, 70, 1217–1240. https://doi.org/10.1007/s12223-025-01324-x
Shetty, Shruthi H.; Shetty, Sumiksha; Singh, Chandra; & Rao, Ashwath. (2022). Supervised machine learning: Algorithms and applications. In P. Singh (Ed.), Fundamentals and Methods of Machine and Deep Learning. https://doi.org/10.1002/9781119821908.ch1
Traidl, S., Mathes, S., & Seurig, S. (2025). AI – one size fits all? Allergologie Select, 9, 75–79. https://doi.org/10.5414/ALX02568E
The pandas development team. (2020). pandas-dev/pandas: Pandas (Version latest) [Software]. Zenodo. https://doi.org/10.5281/zenodo.3509134
Uzoukwu, Ekeoma U.; Phandanouvong-Lozano, Vienvilay; Usman, Huda; Sfeir, Charles S.; & Niepa, Tagbo H. R. (2022). Droplet-based microsystems as novel assessment tools for oral microbial dynamics. Biotechnology Advances, 55. https://doi.org/10.1016/j.biotechadv.2021.107903
Vartoukian, Samuel R.; Moazzez, Ramin V.; & Wade, William G. (2017). Cultivation strategies for the growth of uncultivated bacteria. F1000Research, 6, 578. https://doi.org/10.12688/f1000research.10835.1
Virtanen, Pauli; Gommers, Ralf; Oliphant, Travis E.; Haberland, Matt; Reddy, Tyler; Cournapeau, David; Burovski, Evgeni; Peterson, Pearu; Weckesser, Warren; Bright, Jonathan; van der Walt, Stéfan J.; Brett, Matthew; Wilson, Joshua; Millman, K. Jarrod; Mayorov, Nikolay; Nelson, Andrew R. J.; Jones, Eric; Kern, Robert; Larson, Eric; Carey, CJ; Polat, İlhan; Feng, Yu; Moore, Eric W.; VanderPlas, Jake; Laxalde, Denis; Perktold, Josef; Cimrman, Robert; Henriksen, Ian; Quintero, E. A.; Harris, Charles R.; Archibald, Anne M.; Ribeiro, Antônio H.; Pedregosa, Fabian; van Mulbregt, Paul; & SciPy 1.0 Contributors. (2020). SciPy 1.0: Fundamental algorithms for scientific computing in Python. Nature Methods, 17(3), 261–272. https://doi.org/10.1038/s41592-019-0686-2
Yeo, Kenny; Wu, Fei; Li, Rui; et al. (2024). Is short-read 16S rRNA sequencing of oral microbiome sampling a suitable diagnostic tool for head and neck cancer? Pathogens, 13(10), 826. https://doi.org/10.3390/pathogens13100826
Zaske, Sara. (2025). Energy supplied by the gut microbiome depends on diet. Stanford School of Humanities and Sciences. https://humsci.stanford.edu/feature/energy-supplied-gut-microbiome-depends-diet
Zhang, Yuhan; Luo, Jiahui; Chen, Kuangyu; Li, Na; Luo, Chenyu; Di, Shuang; Qin, Junjie; Zhang, Feng; Chen, Hongda; & Dai, Min. (2025). Cross-cohort analysis identifies shared gut microbial signatures and validates microbial risk scores for colorectal cancer. Journal of Translational Medicine, 23(1), 676. https://doi.org/10.1186/s12967-025-06676-z